Load Testing with Gatling 2

It seems to me that performance testing is often neglected and pushed back as a “nice to have” stretch-goal, instead of being a core part of the test automation strategy. So if you’re putting it off because it seems intimidating or difficult, you’ve come to the right place.
A combination of visual explanation, reading, and hands-on tinkering is usually a winner for me, so: I’ve illustrated some concepts (in Part One) talked about design (in Part Two), and designed a workshop (in part three). I hope you give it a go!
Part Two: Test Design
Now that we’ve covered how web apps work and how Gatling does stuff (in Part One), we can think about how to design our tests. If you really only want to look at code, just skip ahead to Part Three (coming soon), but since I’m a keen advocate of thinking before doing, I’d definitely recommend having a ponder first.
What Does Good Performance Look Like?
I think it bears repeating that using the tool, or writing the test, is not the hard part. Guides and tutorials in a multitude of formats and countless code examples a few clicks away tend to make execution the easier part of the process.
We want to hit a certain series of pages X times within a certain timeframe and check that the application responds in an acceptable way? No problem. The real question: what’s acceptable for this application? What kind of load makes sense in our context?
Defining Service Level Agreements
 Figure 1: A performance tester reacts with some scepticism to 'acceptable timeframe' as sufficient acceptance criteria.
 It may well turn out that we’re not the only ones who don’t know what “acceptable” performance looks like for our application. So (formally, informally, or just for our personal sanity) we probably want to define some Performance SLAs* for our application.
SLAs = Service Level Agreements
Here’s an example:
Our homepage loads in under 3 seconds, measured at the 95th percentile, via Synthetic* tests running on our test environment every 2 hours. We’ll measure this SLA at 0800 CEST every day and base it off the last 24 hours of data.
95th Percentile: Don't worry we'll get to percentiles
Read more about Synthetic versus Real User Monitoring here
 Figure 2: A tester, out of their depth and missing information, takes some wild guesses at what performance should be for the application and is shocked by the results.
 No Guessing!
This isn’t something that we can just guess on our own. SLAs define expectations for service quality and provide a clear target for our team. If we’re sharing these in a wider circle they may well be used to hold us accountable, and setting unrealistic goalposts is going to have repercussions for the whole project. Resolving performance issues can get expensive!
If our team is going to be investing effort meeting these targets, it’s worth spending some time speaking with them (and relevant stakeholders) to define some realistic goals! I wouldn’t want to do any testing before doing at least this much.
 Figure 3: A colleague points out that the tester's guessed assertions are unrealistic.
 Use Real Data
If our app has been out there in the world for a while already, we’ve already got a great resource for determining what users find acceptable: we can simply monitor and observer user behaviour. We’ll quickly get a good idea of what to aim for, as well as the load our application routinely deals with.
We’re not without options if the app is brand-new either. We could ask experienced team members, especially anyone who’s been focusing on usability testing or involved in designing a similar app before, or look to industry standards and competitors.
Creating the Load
How does our system perform under a certain workload? That’s what we’re testing with Gatling. This certain load is, at its core, made up of requests. We vary which requests we send, the order they arrive in, how many users are sending them, and how fast, but choosing the individual transactions to include remains at the core of our testing activities.
The requests we choose determine which components of, and paths through, the system we’re actually putting the stress on. Some transactions may seem different from the user’s point of view, but are computationally the same for the application.
What kind of load are we expecting? It’s not enough to say that we’ll have 500 concurrent users doing something with our application. We need to be specific.
Choosing Transactions
- Which transactions are important to the business (income generators)?
- Which transactions are people sensitive about (previous issues)?
- Consider the ratio (e.g. 80% are of type A, 10% of type B, and so on)
- How quickly do these transactions arrive?
We’re not aiming for perfection here, so don’t worry too much about getting it exactly right. We just need to be good enough.
We can validate our choices somewhat by running our test with everyday workload values, and checking whether the performance is about the same as we would expect. Ramping things up and really stressing the system comes later.
 Figure 4: A person wrestling with Perfection finds that aiming for good enough is a better approach.
 Choosing Metrics
Once we’ve got a general idea of our goals, i.e. what kind of response time and error rate our users will find acceptable (again, there’s no one answer here, it’s all about context), and which transactions we want to include, we can think more specifically about our tests.
Gatling collects data on:
- Response Time
- Responses Per Second
- Successful / Failed Requests
And provides us with details in the form of:
- Min, Max & Mean
- Standard Deviation
- Percentiles
We write our assertions (tests) using conditions such as:
- The Max Response Time of All Requests is Less Than 100ms
- No More Than 5% Failing across All Requests
- The Percentage of Failed Requests called “ImportantRequests” in the Group “SeriouslyTheseAreCritical” is 0%
This is where domain knowledge is really key. If we don’t know, for example, which transactions are critical for the business, we need to find someone who does and talk to them! These are things we need to consider when we’re creating the load, but more on that later. Back to metrics.
 Figure 5: In a restaurant, a head waiter triumphantly announces that customers received their meals, on average, in under 10 minutes.
 Why are Averages Misleading?
If you’re thinking about merely looking at the average response time and calling it a day, think again! We need to consider all the metrics in order to build up as complete a picture as possible of the application’s behaviour. All of them.
Why is the average response time alone not a good measure?
Let’s look at this set of response times (in seconds, for simplicity’s sake):
| Response Times (s) |
| 2, 3, 2, 3, 1, 2, 3, 1, 2, 10, 2, 3, 1, 2, 1, 3, 2, 20, 1, 2, 2, 1 |
The mean response time here is 3 seconds. Taken alone, you might conclude that all is well!
But wait, is that a.. 10 second response time in that sample? 20 seconds??
It’s easy to see, in these tiny little example data sets, what’s going on. In reality, our datasets are likely to be far too big to scan ourselves. It won’t be so obvious that there are anomalies, and we’ll need more than averages to tell.
 Figure 6: Another waiter points out that they had one customer who had to wait an hour.
 Standard Deviation
Standard deviation is a number used to tell how measurements for a group are spread out from the average (mean or expected value). A low standard deviation means that most of the numbers are close to the average, while a high standard deviation means that the numbers are more spread out. — wikipedia
 Figure 7: The head waiter wonders how they can determine whether the average of 10 minutes represents the typical experience for their customers.
 Let’s look at that in context:
| Response Times (s) | Mean | SD |
| 2, 3, 2, 3, 1, 2, 3, 1, 2, 2, 3, 1, 2, 1, 3, 2, 1, 2, 2, 1 | 2 | 0.7 |
Our mean for the above set is 2, and since all the values are close to 2, our standard deviation (SD) is low.
Our response times don’t vary too much. That’s what we like to see!
| Response Times (s) | Mean | SD |
| 2, 3, 2, 3, 1, 2, 3, 1, 2, 10, 2, 3, 1, 2, 1, 3, 2, 20, 1, 2, 2, 1 | 3 | 4 |
For our problematic set from earlier then, our SD is much higher. Our response times vary more.
By looking both at the mean and the SD, we get a better picture of our data.
We can look at standard deviation to see how much our response times vary from the average, but it’s still not clear what’s going on. We can see that there was a lot of deviation from the average, but how many of our response times were problematic?
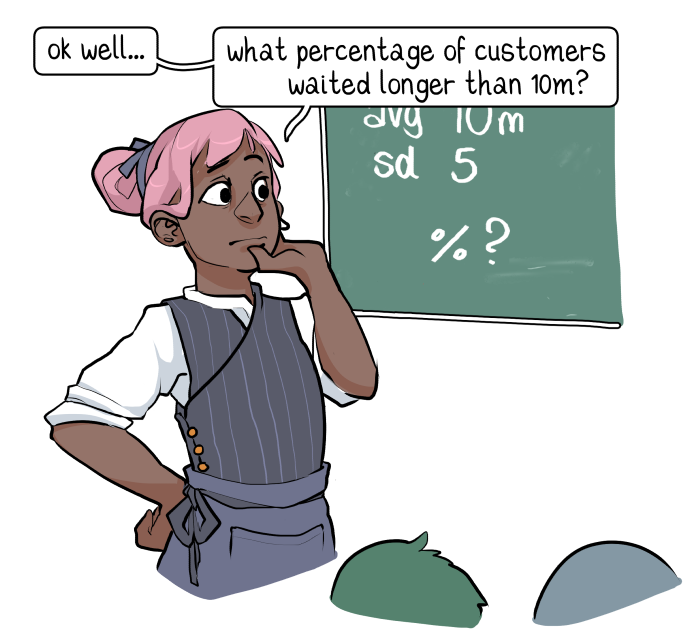 Figure 8: Trying another approach, the head waiter wonders what percentage of customers waited for longer than 10 minutes.
 Percentiles
Percentiles are what we use if we want to know where a value falls within a distribution. How a particular response time compares to the others.
If response time X is at the Yth percentile, then X is greater than Y% of values.
Let’s look at some examples:
| Response Times (s) | 75th | 95th | 99th |
| 2, 3, 2, 3, 1, 2, 3, 1, 2, 2, 3, 1, 2, 1, 3, 2, 1, 2, 2, 1 | 2.25 | 3 | 3 |
Measured at the 99th Percentile, our response time was 3 seconds.
So a response time of 3 is greater than 99% of all response times.
In other words, 99% of our response times were under 3 seconds!
| Response Times (s) | 75th | 95th | 99th |
| 2, 3, 2, 3, 1, 2, 3, 1, 2, 10, 2, 3, 1, 2, 1, 3, 2, 20, 1, 2, 2, 1 | 3 | 9.7 | 17.9 |
Measured at the 75th Percentile, our response time was 3 seconds.
So this time only 75% of our response times were under 3 seconds.
That means that 25% took 3 seconds or longer.
95% took 9.7 seconds or less, so 5% of our response times took longer than 9.7 seconds. Ultimately, only 1% of our response times took longer than 17.9 seconds. Which may or may not be acceptable.
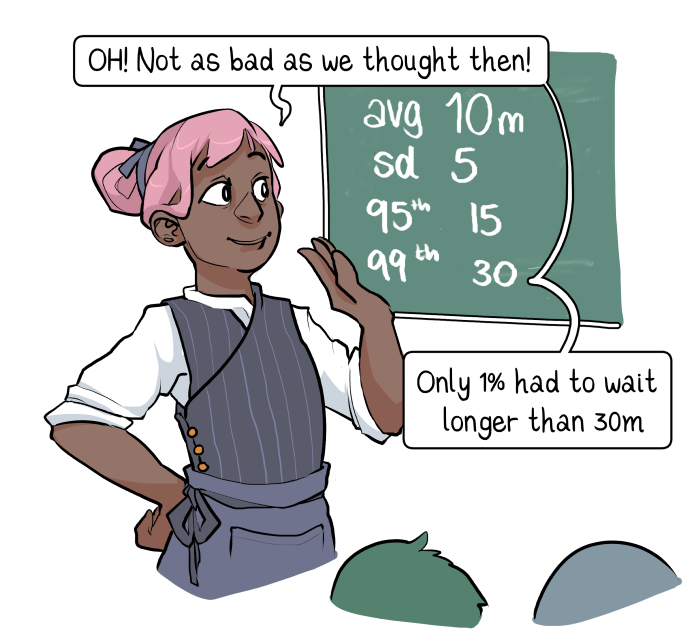 Figure 8: The head waiter, with some relief, finds that only 1% of their customers had to wait for longer than 30 minutes.
 Taken all together the mean, standard deviation, and percentiles provide us with a much better idea of how our response times varied than by considering any one measure on its own. We should be using all of them to write our assertions.
Other Considerations
Does our app do any caching?
… Are we sure?
Beware Caching
Don’t assume! We need to check to see whether there’s caching, and find a way to circumvent it if we don’t want to test it. Of course, it could be that we specifically want to test caching, to see if it really improved performance.
Network Connections
Let’s consider our user base. What networks are they using? There’s a big difference between, say, fibre-optic and mobile connections. If the majority of our users are in rural areas with slow internet connections, we probably want to know what performance is like for them!
Consider also that distance does matter when it comes to the internet. We might need to test from several key geographic locations using cloud services, for example.
The Test Environment is Important
 Figure 9: An apathetic developer shrugs off environmental factors by stating that it works on their machine, while their colleague despairs.
 Let’s not delve into whether or not to test in production, and just remember that it’s important to get as close to an exact replica of the production system/environment as possible.
Recruit others to help create an accurate environment, and push for the best that’s possible. Using the same test system where all the other testing happens, or an environment that’s ‘close enough’ to the real thing, are going to lead to (possibly wildly) inaccurate results.
It’s easier said than done, I know, but if there are too many differences our test results become rather useless.
Don’t Disrupt without Warning!
How disruptive are our load tests going to be? Well, it depends on how hard we’re pushing the system, but it’s not inconceivable that the application will have unexpected problems long before we anticipate any measurable differences in performance.
There may be automated alerts, concerned citizens and monitoring dashboards making noises and turning red and/or pale when the application starts struggling under the load.
Don’t run your load tests without informing other people in plenty of time!
 Figure 10: A Monitoring System runs screaming through the office, showering all in panicky error notifications.
 End of Part Two
That’s it for Test Design! Keep an eye out for Part Three where we’ll be learning how to actually use Gatling with code walkthroughs and workshop exercises.